
At 5E we are collecting data from a number of sources and publishing them through our dashboard, Memphi, and interactive dashboard tool with Artificial Intelligence , and Machine Learning capabilities. Graphs are interactive and provide filtering, downloads and snap shot images.
The dashboards below represent a sample of the data we collect and can make available.
COVID-19 Dashboards
NEW (July 5,2020) –
Map and Slider – Dashboard with county map and slider to see the case increase more clearly.
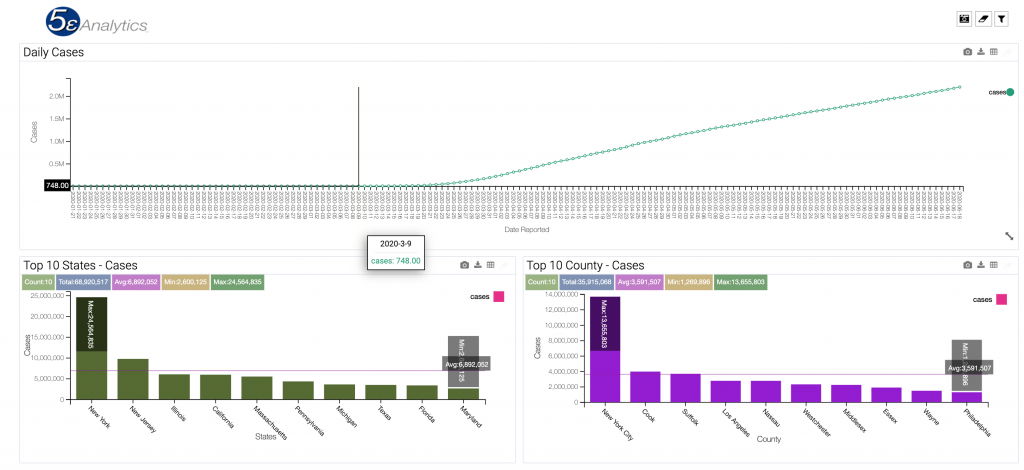
Cases – Dashboard to provide the number of cases in the US, top ten states and top ten counties
Case Increase – Dashboard to provide the increase in cases daily in the US.
Deaths – Dashboard to provide the number of deaths in the US, top ten states and top ten counties