

Many companies are now utilizing the NPS, Net Promoter Score, developed by Satmetrix to determine a company’s growth. The score is based on a single question which asks the likelihood of the respondent to recommend a product or service using an 11-point scale, 0-10. While the technique has its proponents and detractors, this articlewill not serve to validate or criticize the instrument, but rather, provide help bring clarity to analyzing it effectively from a statistics point of view.
Personally, I have seen many analysts work with correlations to try and identify relationships between survey items and the recommend score. This method does provide some interesting insight, however, one should be careful using correlations. In a recent article, I cautioned about the improper use of correlations [Article: Beware of Correlations].
The most popular correlation method, although many analysts don’t realize that there are other methods, is the Pearson correlation, which assumes a linear relationship between the two variables, and is more robust when the two variables are normally distributed, although normality is not required. The NPS score is an ordinal value, and therefore linearity may be an issue. Using a non parametric correlation is probably the best bet. I would suggest that you utilize the Spearman’s Rank Correlation, or Kendall’s Tau, which compares the rank of the observations.
Below is an example of 20 NPS scores and an associated question for comparison [Code written in R]. When we run the Pearson correlation (.48), we get a similar value to Spearman’s correlation (.48), but Kendall’s Tau is lower (.40). When we have some outliers present, the values of the correlations begin to spread even more (Pearson – .67, Spearman – .56, Kendall -.48). Thus the correlation may not be as strong if one had used Pearson instead of Kendall. The plots show that when we rank the data, the effect of the outlier is managed and the effect is obvious in the image.
It should be noted all statistical packages can compute the three types of correlations, however, Excel’s correlation function uses the Pearson method. It is possible to compute Kendall and Spearman’s correlation in Excel, but that will be discussed in a different article.
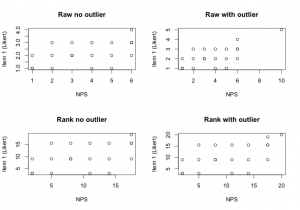
== R-CODE ==
w<- c(1,1,1,2,2,2,3,3,3,4,4,4,5,5,5,6,6,6,6)
p<- c(1,1,2,1,2,3,2,2,3,1,2,3,1,2,3,2,3,3,4)

w1<- c(1,1,1,2,2,2,3,3,3,4,4,4,5,5,5,6,6,6,6,10)
p1<- c(1,1,2,1,2,3,2,2,3,1,2,3,1,2,3,2,3,3,4,5)


round(cor(w,p, method="pearson"),2)
round(cor(w,p, method="spearman"),2)
round(cor(w,p, method="kendall"),2)

round(cor(w1,p1, method="pearson"),2)
round(cor(w1,p1, method="spearman"),2)
round(cor(w1,p1, method="kendall"),2)


par(mfrow=c(2,2))
plot(w, p, main="Raw no outlier", ylab="Item 1 (Likert)", xlab="NPS")
plot(w1, p1, main="Raw with outlier", ylab="Item 1 (Likert)", xlab="NPS")

plot(rank(w), rank(p), main="Rank no outlier", ylab="Item 1 (Likert)", xlab="NPS")
plot(rank(w1), rank(p1), main="Rank with outlier",ylab="Item 1 (Likert)", xlab="NPS")